Hans Kratz
Donnerstag, 19. Oktober 2017
|
|
Eine gute Datenquelle zum Klimawandel
findet Ihr hier
https://www.carbonbrief.org/data-dashboard-climate-change
"Carbon Brief is a UK-based website covering the latest developments in climate science, climate policy and energy policy. We specialise in clear, data-driven articles and graphics to help improve the understanding of climate change, both in terms of the science and the policy response. We publish a wide range of content, including science explainers, interviews, analysis and factchecks, as well as daily and weekly email summaries of newspaper and online coverage."
|

Hans Kratz
Mittwoch, 11. Oktober 2017
|
|
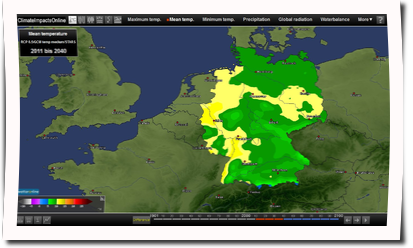
Auf der Seite
http://www.climateimpactsonline.com/
findet Ihr ein Onlinemodell, welches zu einer ganzen Reihe von Aspekten (Temperatur, Landwirtschaft, Forstwirtschaft, etc. ) auf einer Deutschlandkarte die vorraussichtlichen Veränderungen visualisiert.

|

Hans Kratz
Sonntag, 8. Oktober 2017
|
|
Guardian 05.10.2017
Carbon emissions from warming soils could trigger disastrous feedback loop
26-year study reveals natural biological factors kick in once warming reaches certain point, leading to potentially unstoppable increase in temperatures
https://www.theguardian.com/environment/2017/oct/05/carbon-emissions-warming-soils-higher-than-estimated-signalling-tipping-points?utm_term=Autofeed&CMP=twt_bgdnnews#link_time=1507228054
|

Hans Kratz
Samstag, 7. Oktober 2017
|
|
Einige informative Info-Grafiken findet Ihr unter der folgenden Adresse:
https://sealevel.nasa.gov/resources/56/infographic-sea-level-rise
|


Kategorie:
Infomaterial